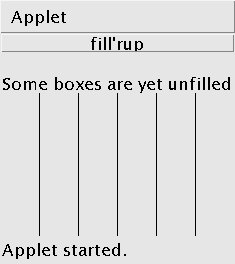
Before any boxes have been filled

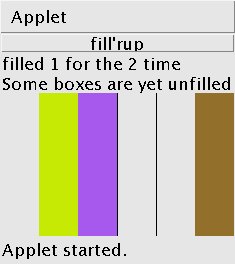
After a few boxes have been filled.

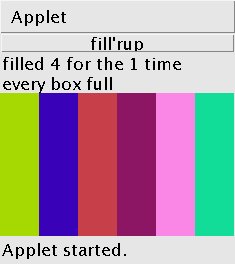
After every box has been filled.
For my implementation, I chose to have one button and two labels. The button named "fill'rup", simply causes a box to be randomly picked for filling. If he box has already been filled, so be it. One of the labels, the upper one in the images below, shows the number of times the currently selected box has been filled. The other label simply says "More filling needed" or "every box filled" depending on whether or not every box is filled.
Boxes can be made by simply dividing the applet into a grid using vertical lines (as shown in the leftmost image). You might look at you homework 4 to remember how to do this. Then, when a box is filled change the color of the box to something other than white. (I use a randomly selected color.)
Your applet should have 6 boxes.
Here are some example images from my reference implementation.
 Before any boxes have been filled |  After a few boxes have been filled. |  After every box has been filled. |
When everything is working, count the number of button clicks needed to fill one box, then 2 boxes, then 3 boxes, ... Repeat this several times then draw a graph of the average number of button hits needed to fill each number of boxes. Finally, write less than one page explaining why it takes far more than 6 button hits to fill all 6 boxes. Your explanation might go on to speculate about filling up 10 boxes or 100 boxes using this approach. For example, suppose it took, on average 30 clicks to fill the 6 boxes (NOTE: 30 is definitely wrong so do not report this as your answer). Would you expect it would take 50 clicks to fill 10 boxes (you could do this experiment), or more or less. Would it take 500 clicks to fill 100 boxes? (You could also do this experiment, but it might get pretty boring.)
| Grading: | Applet | 90 pts |
|---|---|---|
| Analysis | 10 pts |
int appX = (int) getSize().getWidth();
int appY = (int) getSize().getHeight();
| 5 points | Rather than simply filling your boxes with a block of color, fill them with something more interesting. For example, fill the boxes with a cardioid as we drew in class just after break. |
| 5 points | If you do the first extra credit, use fillPolygon to create a cardioid that is full of color. |
| 5 points | Make the box show the number of times it has been filled. For example, you might make the box into a sort of bar chart, where the height of the color in the box is dependent on the number of times it has been filled. |